Scott Hanselman, a Microsoft vice president known for his work across the company’s developer ecosystem, has introduced an open-source GPU task manager called gputaskman. The tool is designed to answer a question that has become increasingly common as local AI workloads grow: what exactly is consuming your graphics memory? Hanselman described the project on social media as a way to gain insight into where GPU memory is going, noting that a great deal is happening inside his GPU at any given moment.
The utility runs on Windows, Linux, and macOS. Its terminal-style interface lists running processes alongside per-process GPU usage and VRAM consumption. It also reports active runtimes and a range of additional statistics, making it a broader monitoring tool than its name alone might suggest.
Built with AI and LLM workloads in mind
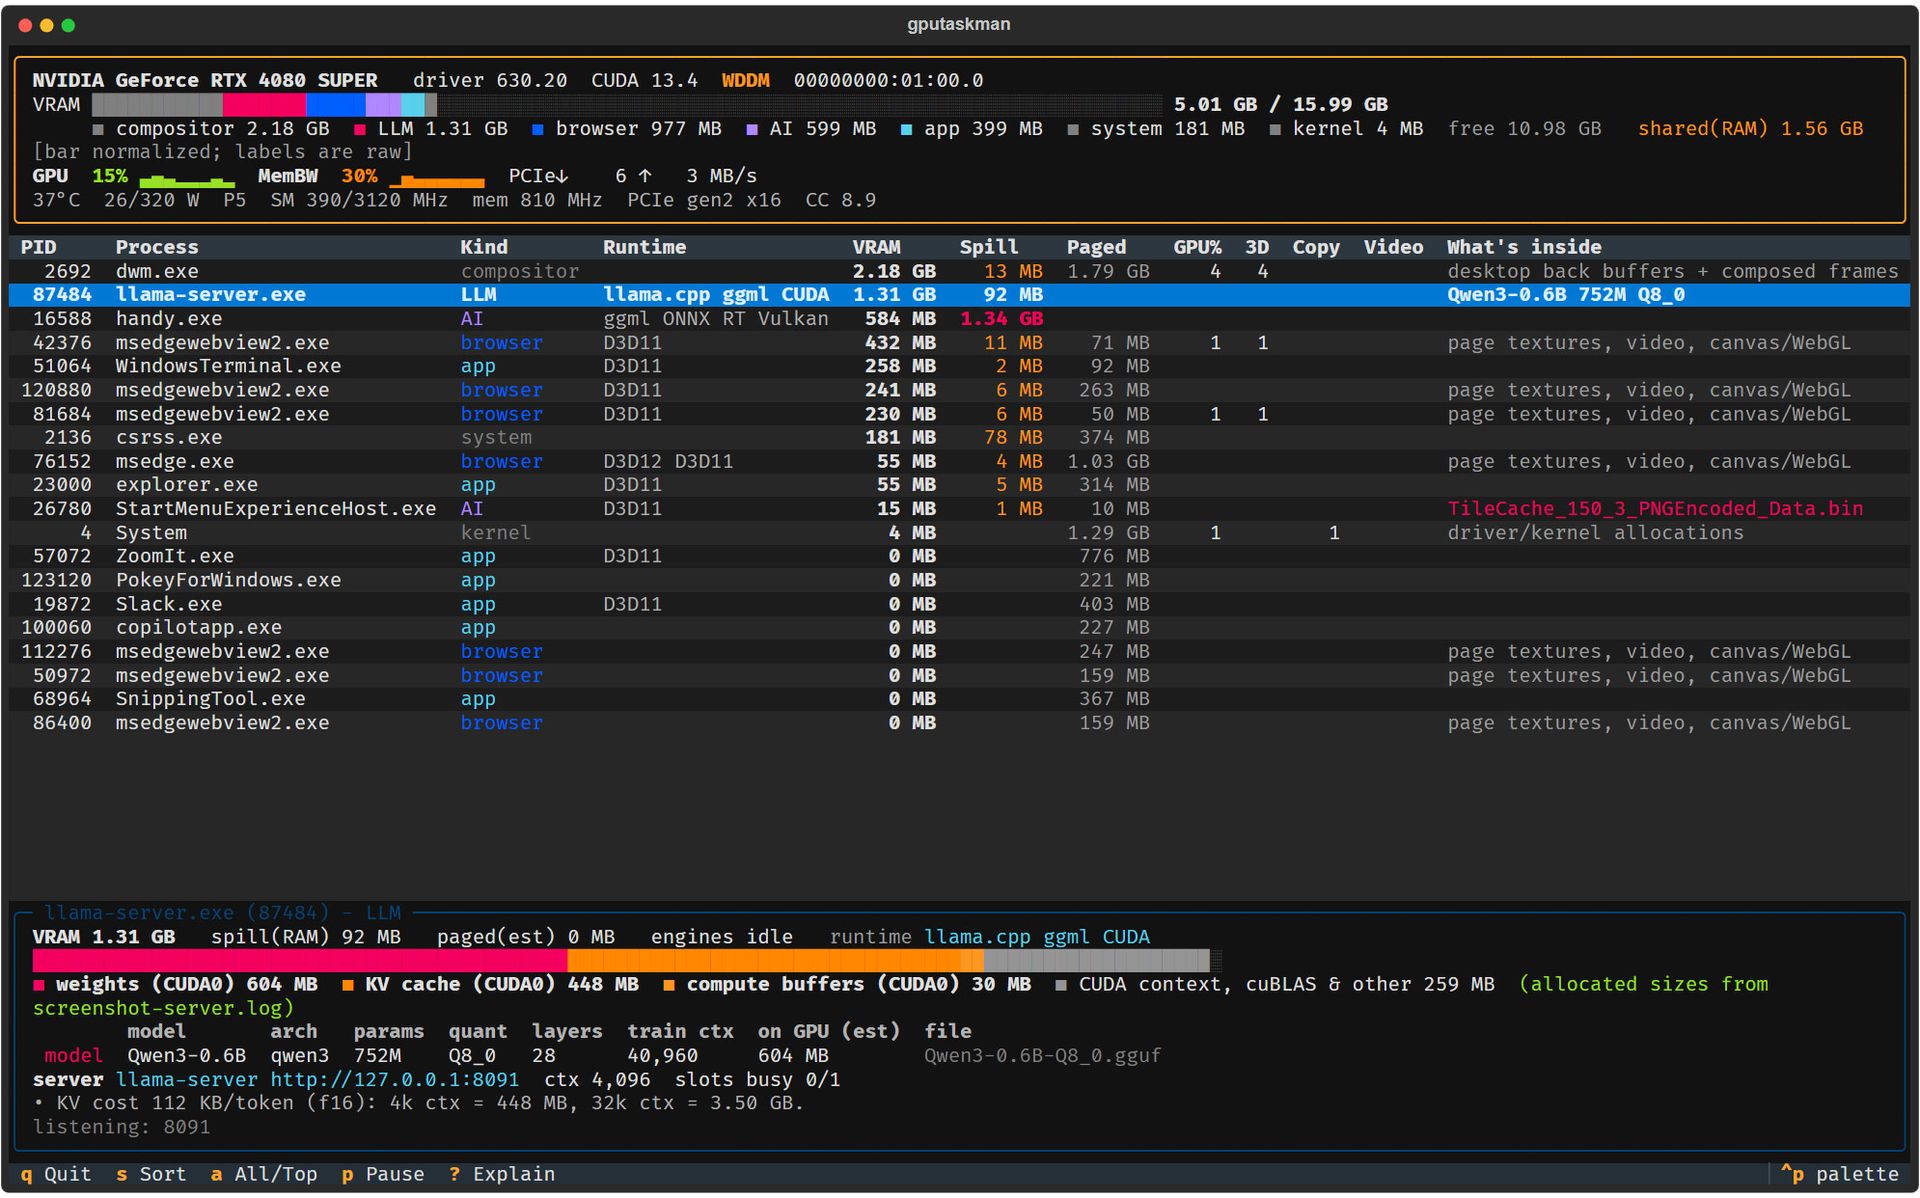
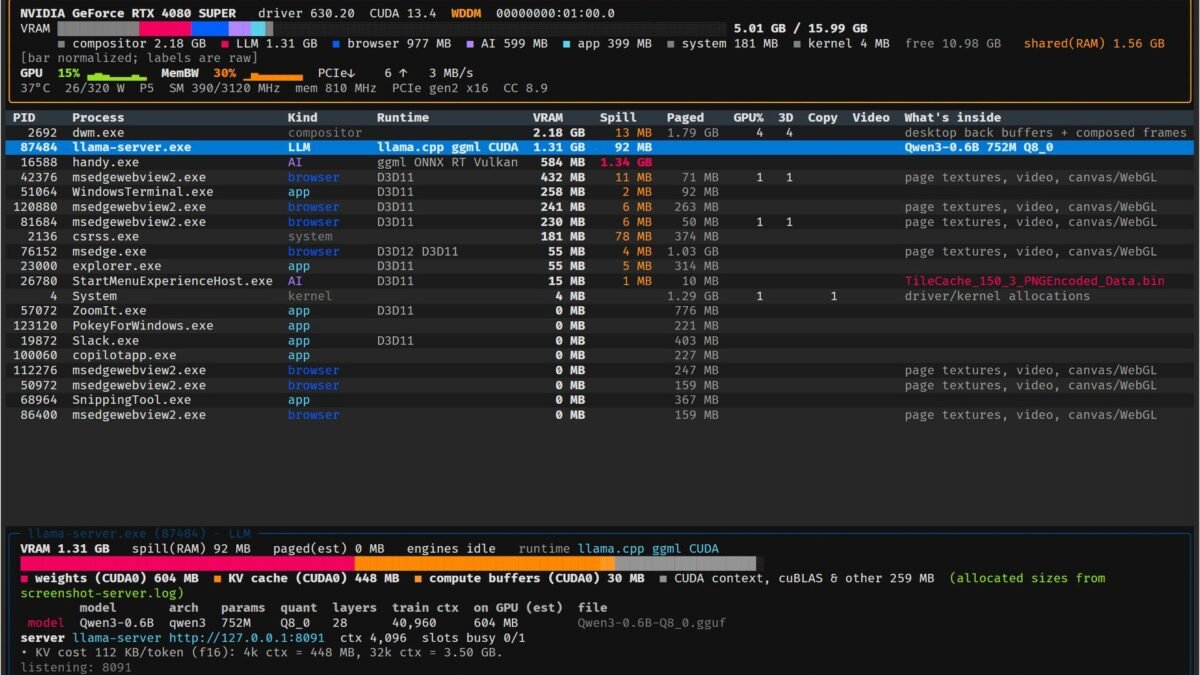
A notable part of gputaskman is its handling of AI and LLM tasks. The tool breaks out task-specific information that ordinary GPU monitors typically do not surface. In one example screenshot shared by Hanselman, selecting the llama-server.exe process reveals details about the model in use, including that Qwen3-0.6B is running. The same view breaks down the model’s weights, its KV cache, the number of parameters, and other related figures.
Hanselman’s own system, an RTX 4080S, offers a useful illustration of how crowded a modern GPU can become. In his screenshot, the desktop windows manager is the most VRAM-hungry application, and selecting it in the list brings up further details at the bottom of the window. AI and LLM applications also appear in the list consuming VRAM, alongside several standard Windows processes.
Hands-on with a laptop GPU
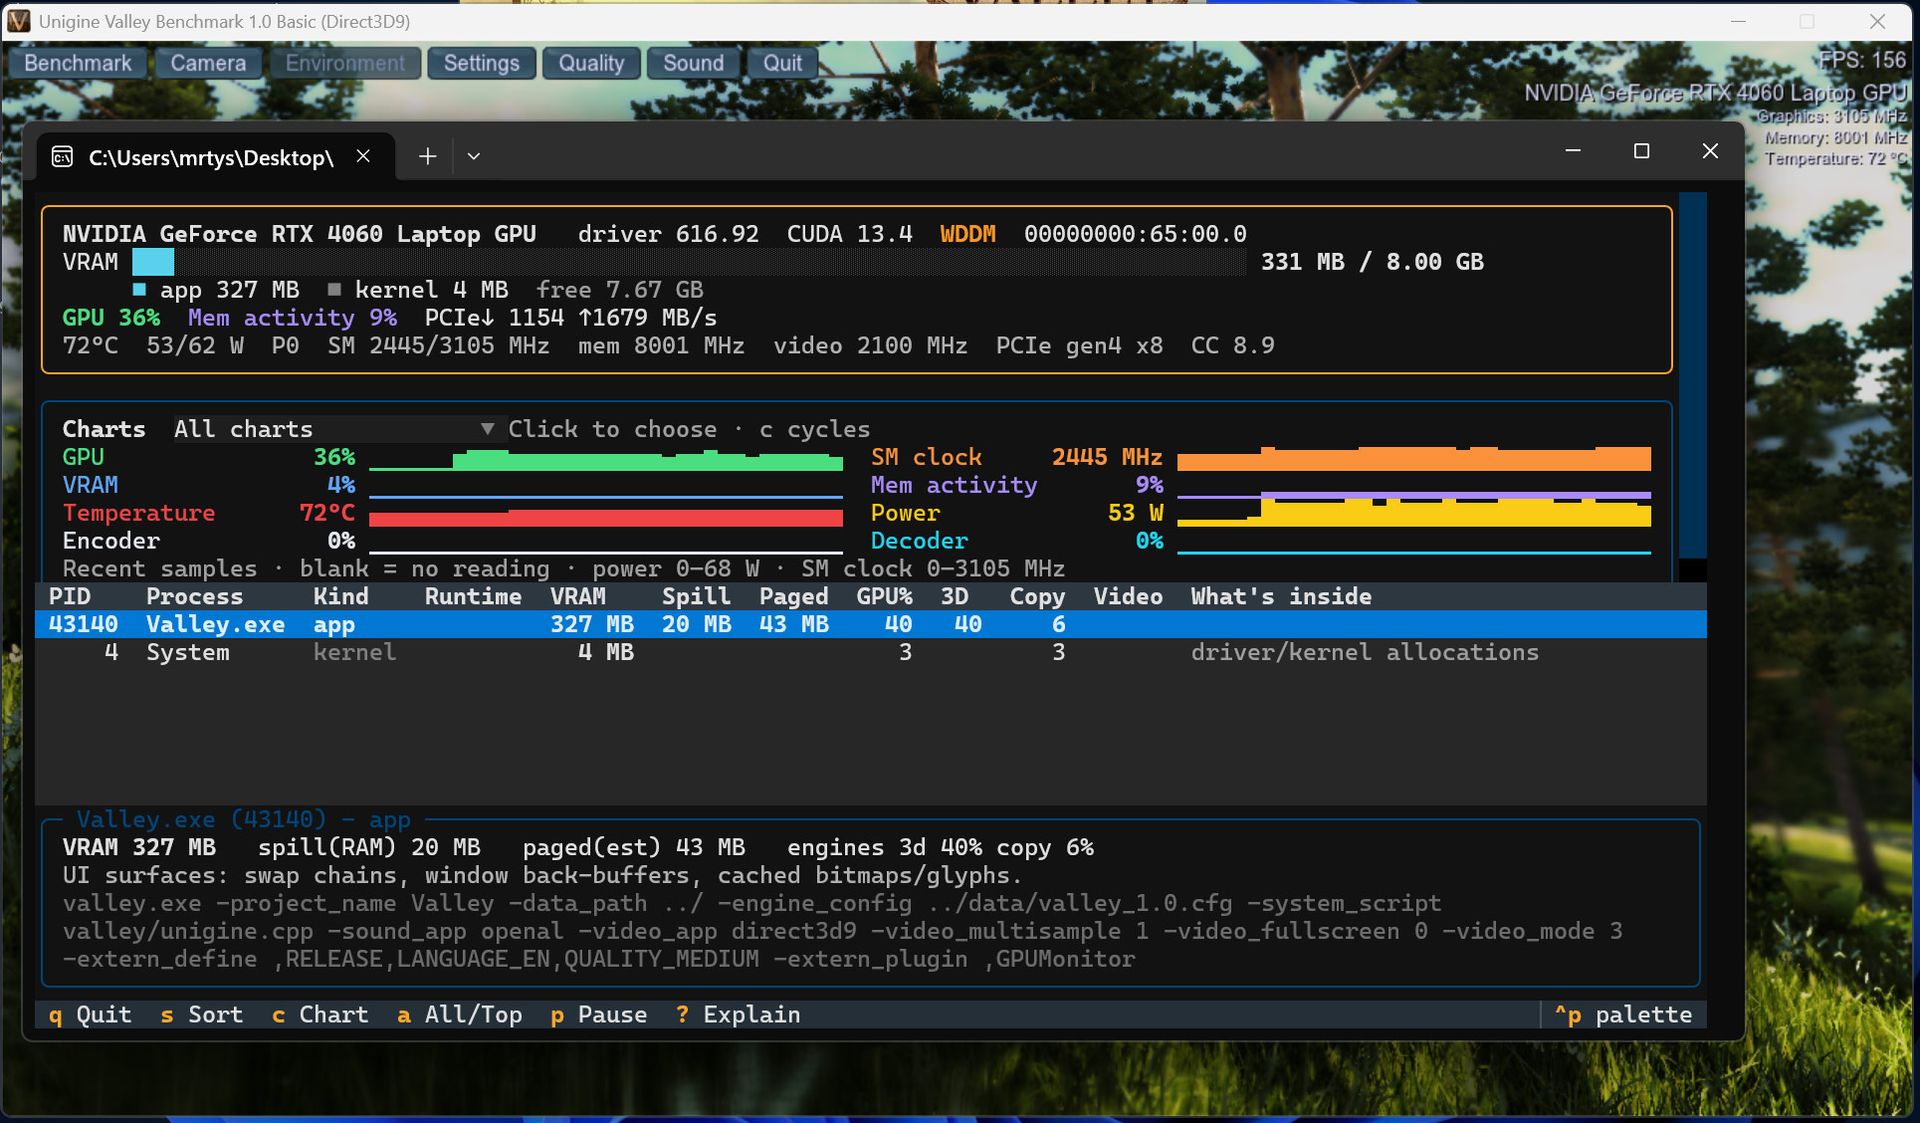
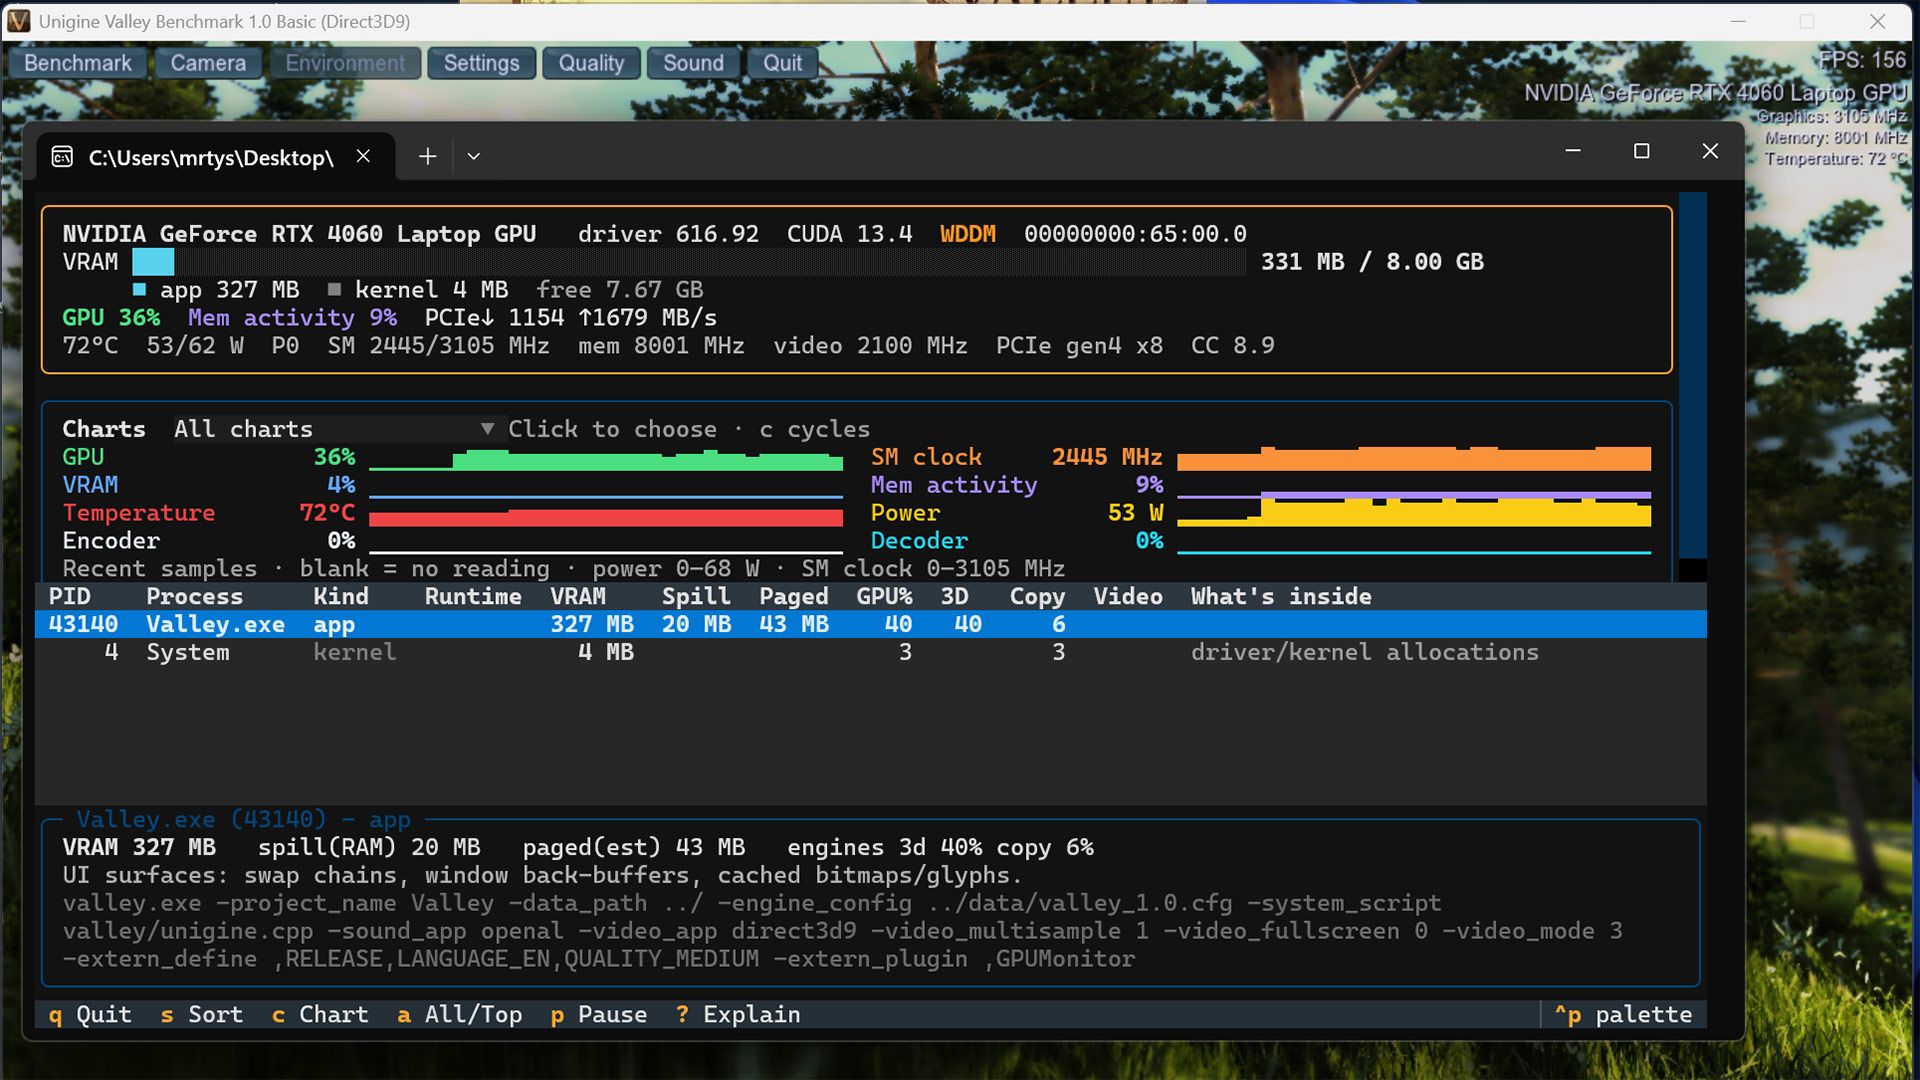
The latest release, version 0.3.0, is available as a portable Windows download, which makes it easy to try without a formal installation. On a laptop equipped with an RTX 4060, a first launch showed no tasks using the discrete GPU. Running the Unigine Valley GPU benchmark changed that, waking the graphics processor and giving the tool something to measure.
The live-streaming charts for GPU load, VRAM use, temperature, and related metrics appeared more prominent in that test than in Hanselman’s shared examples, which may reflect differences between versions of the software. The tool’s interface presents these readings in a compact, terminal-like display that updates as workloads change.
Open source and a hint of broader Windows monitoring
Hanselman is distributing gputaskman as experimental software under the permissive MIT license, and the GitHub repository contains further information about its inner workings along with the source code itself. In social media comments, he also hinted that expanded GPU monitoring capabilities could eventually arrive in Windows as a standard feature.
For users who run local models, games, or other GPU-heavy applications, the appeal is straightforward: a single view that attributes memory use to specific processes rather than leaving it as an unexplained total. The project’s scope, spanning per-process usage, runtime information, and AI-specific breakdowns, positions it as a practical diagnostic aid for anyone trying to understand what is happening inside their graphics card.