
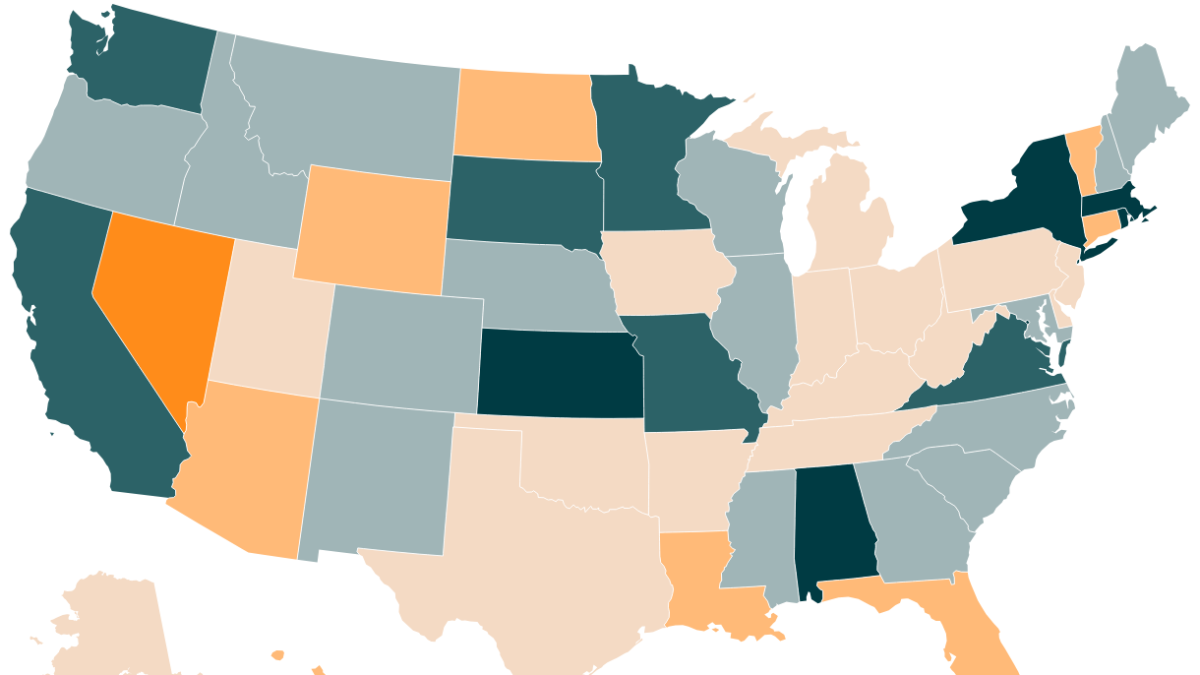
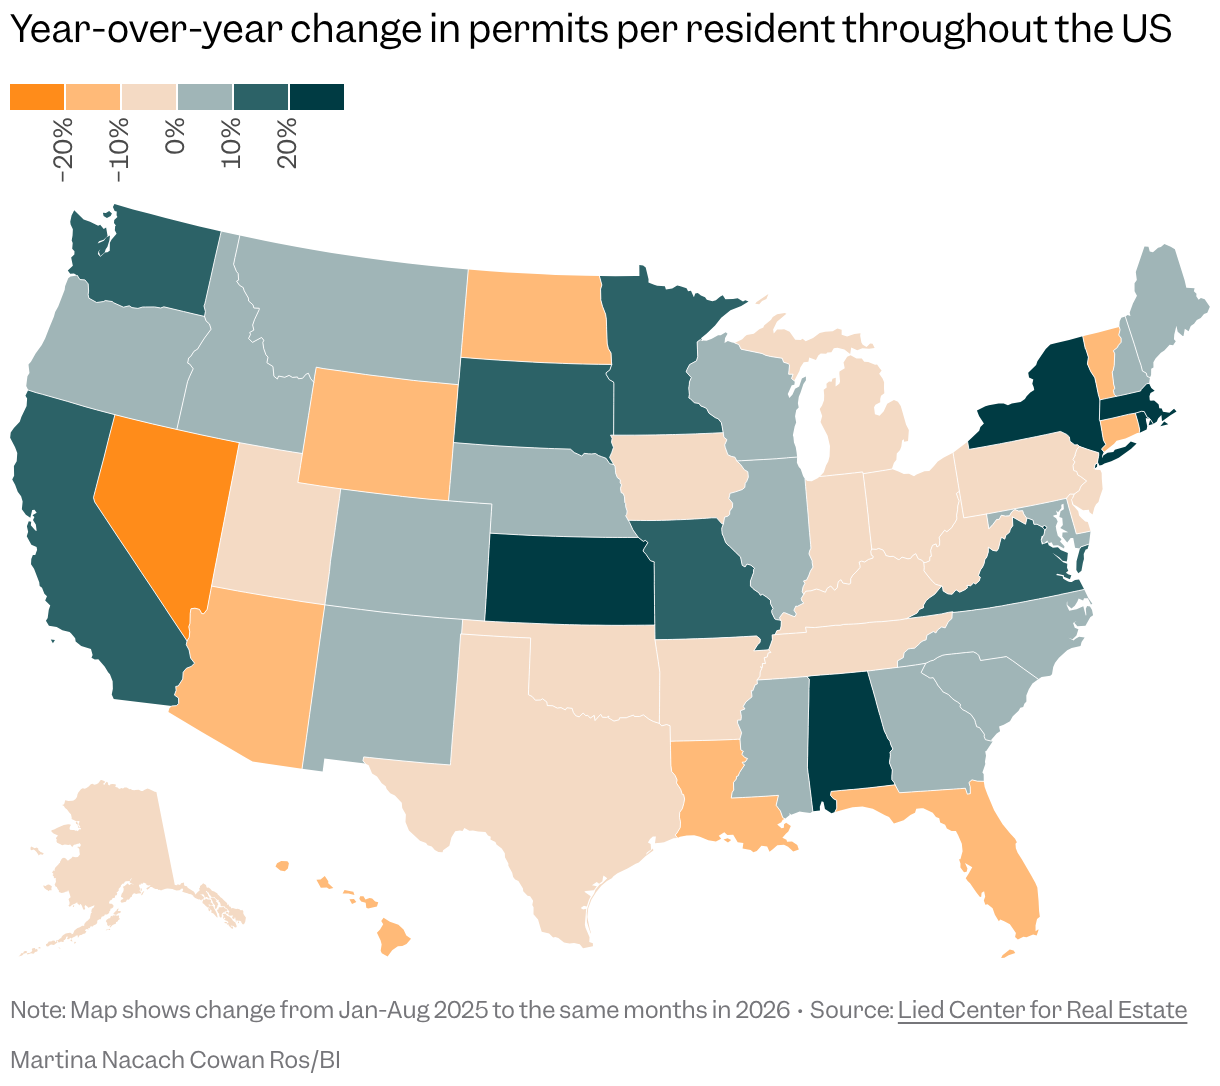
New housing construction is barely keeping pace nationwide, but the national figure hides a wide gap between states that are still approving projects and those that have all but stopped. An October analysis of housing permits by state from the Lied Center for Real Estate at the University of Nevada, Las Vegas, found that permitting was essentially unchanged from January through August 2026, edging up just 0.05% over 2025 and falling 4.1% from 2023.
Nicholas Irwin, a coauthor of the report and the center’s research director, was blunt about the national : the country is doing a poor job of building housing. Some states are managing better than others, he said, but many places are falling well behind.
What the national numbers show
From January to August 2026, 968,187 permits were issued across the country. That works out to roughly 2.83 permitted units per 1,000 residents. Single-family homes made up 64% of the total, and multifamily homes accounted for 32%.
The permit count matters because it offers a preview of how much housing may reach the market in the years ahead. Irwin warned that a thin pipeline could weigh on both affordability and future economic growth if new households form without enough homes to absorb them.
States issuing the most permits
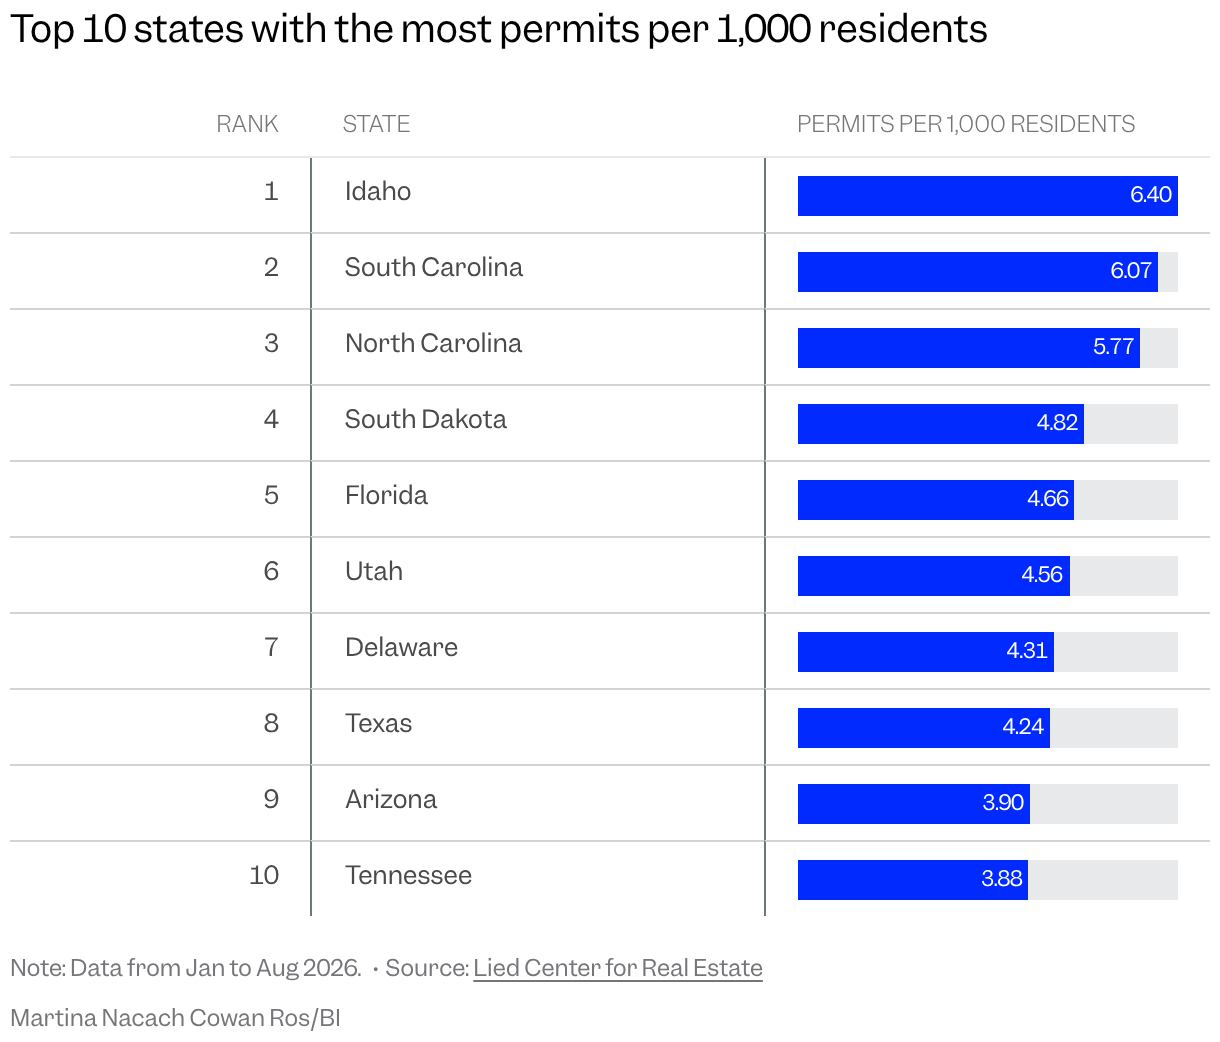
South Carolina, Idaho and North Carolina recorded the highest permit rates per 1,000 residents, each at least twice the national average. Irwin said those states could eventually see slower price growth. As wages rise and building continues, he suggested, the added supply can push housing prices downward and make homes more attainable.
New York was among the states where permits increased, while Nevada saw a decline.
States issuing the fewest permits
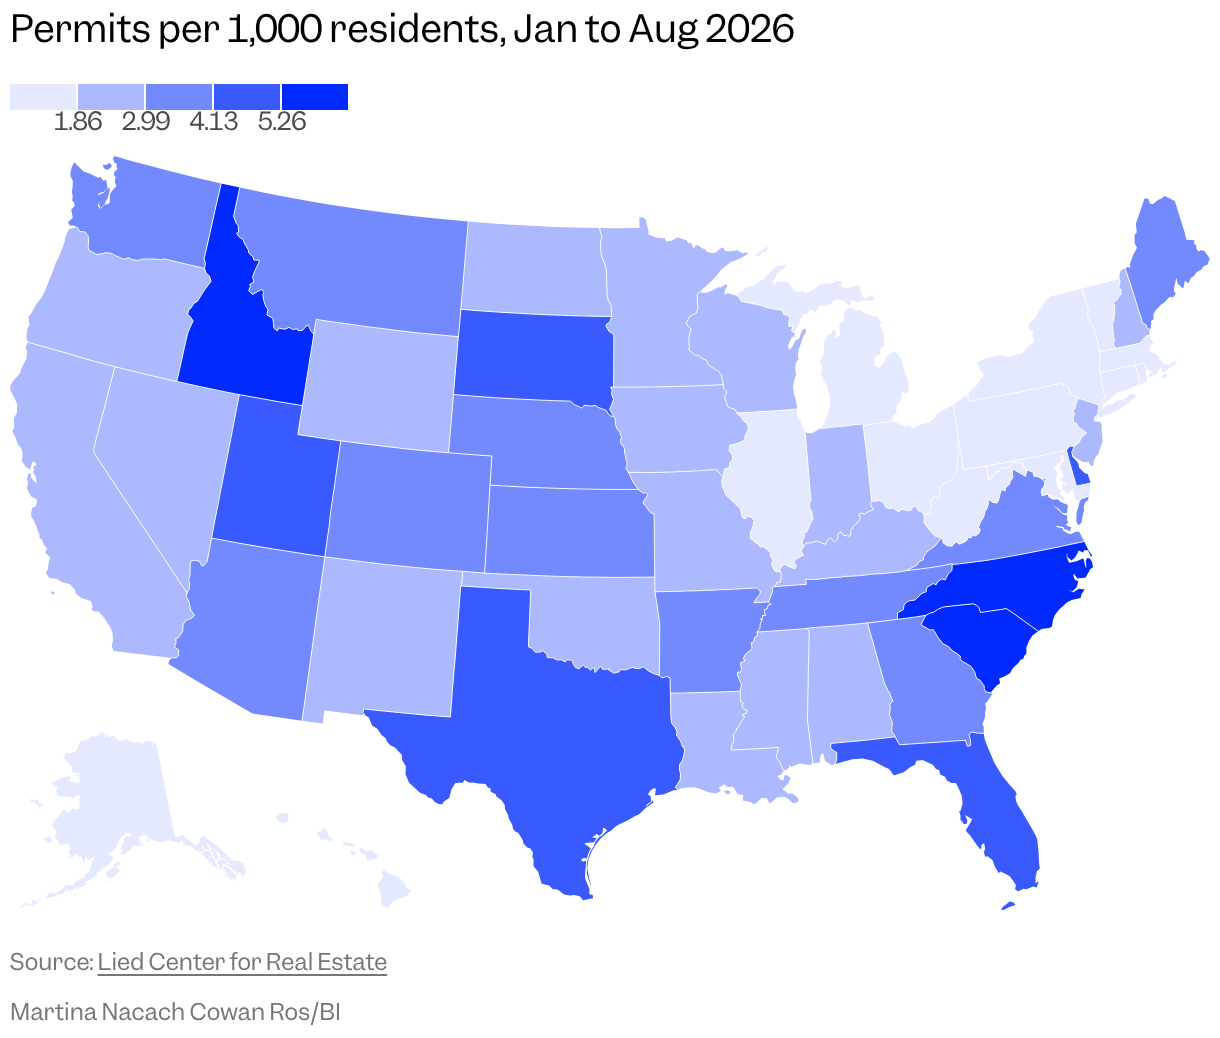
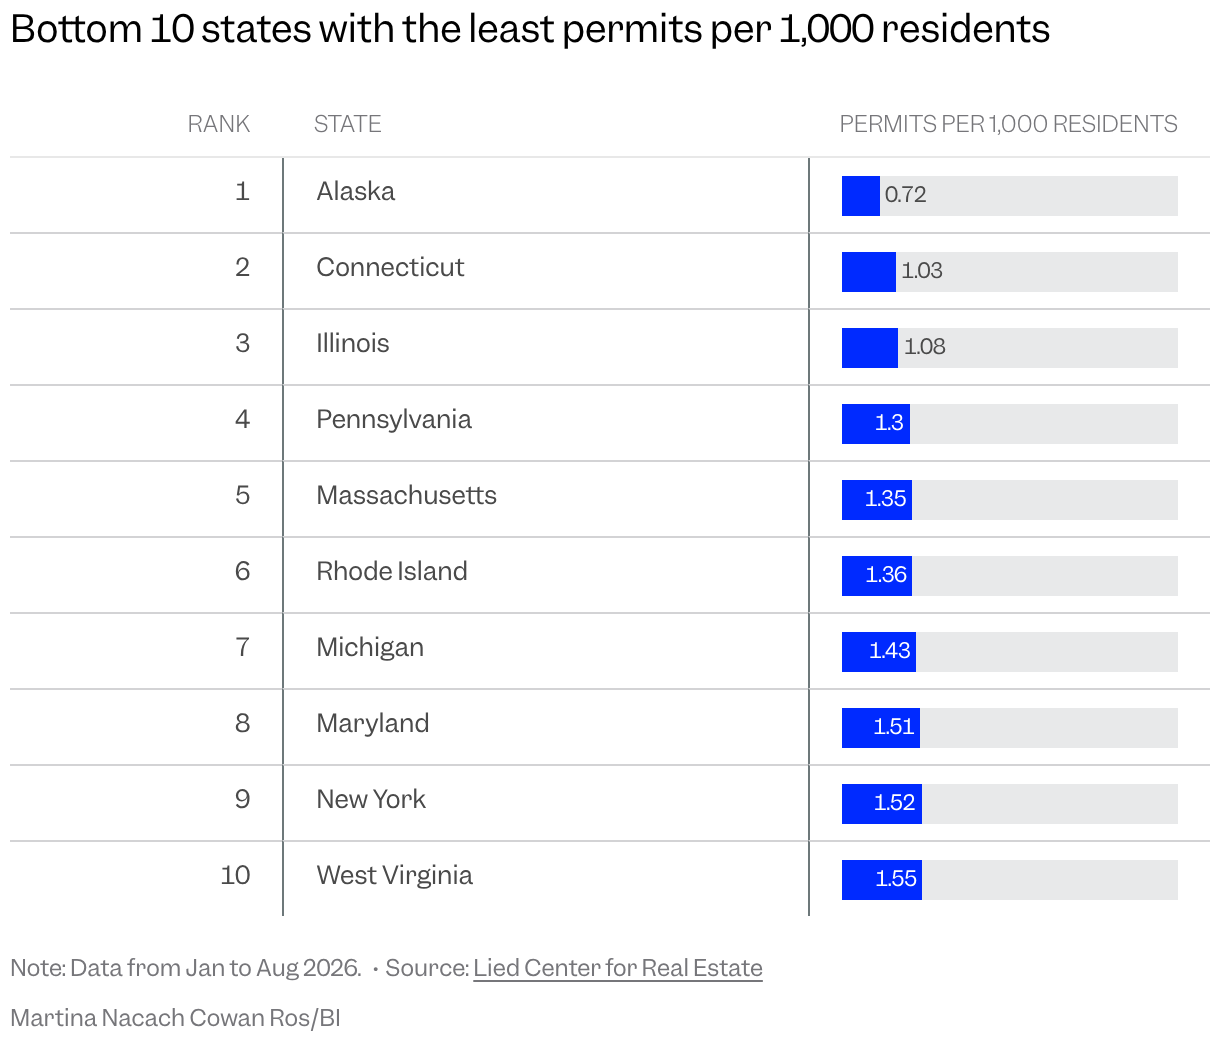
At the other end of the ranking, Alaska, Connecticut and Illinois had the lowest per-capita permit rates among the states.
The affordability gap, state by state
The report also measured the income needed to buy each state’s median-priced home against the median income of homeowner households. In 31 states, that typical homeowner earns less than what is required.
California had the widest shortfall. Its median homeowner income is $138,800, about $84,900 below the level needed to afford a median-priced home in the state. Iowa sat on the opposite side: the typical homeowner there earns $22,300 more than the required income.
Why state policy matters
Irwin said states should keep approving every kind of housing to improve affordability, and that local policy incentives are one route. He described states as laboratories for democracy, noting that they take very different approaches to allowing housing construction and to how much say local governments have in blocking it.
The national permit figure has been close to flat for months, but the state-level differences suggest that the country’s housing supply problem is not evenly distributed — and that some markets may find relief sooner than others.